Italians drive badly? Dutch think so, but numbers tell otherwise
Driver behavior
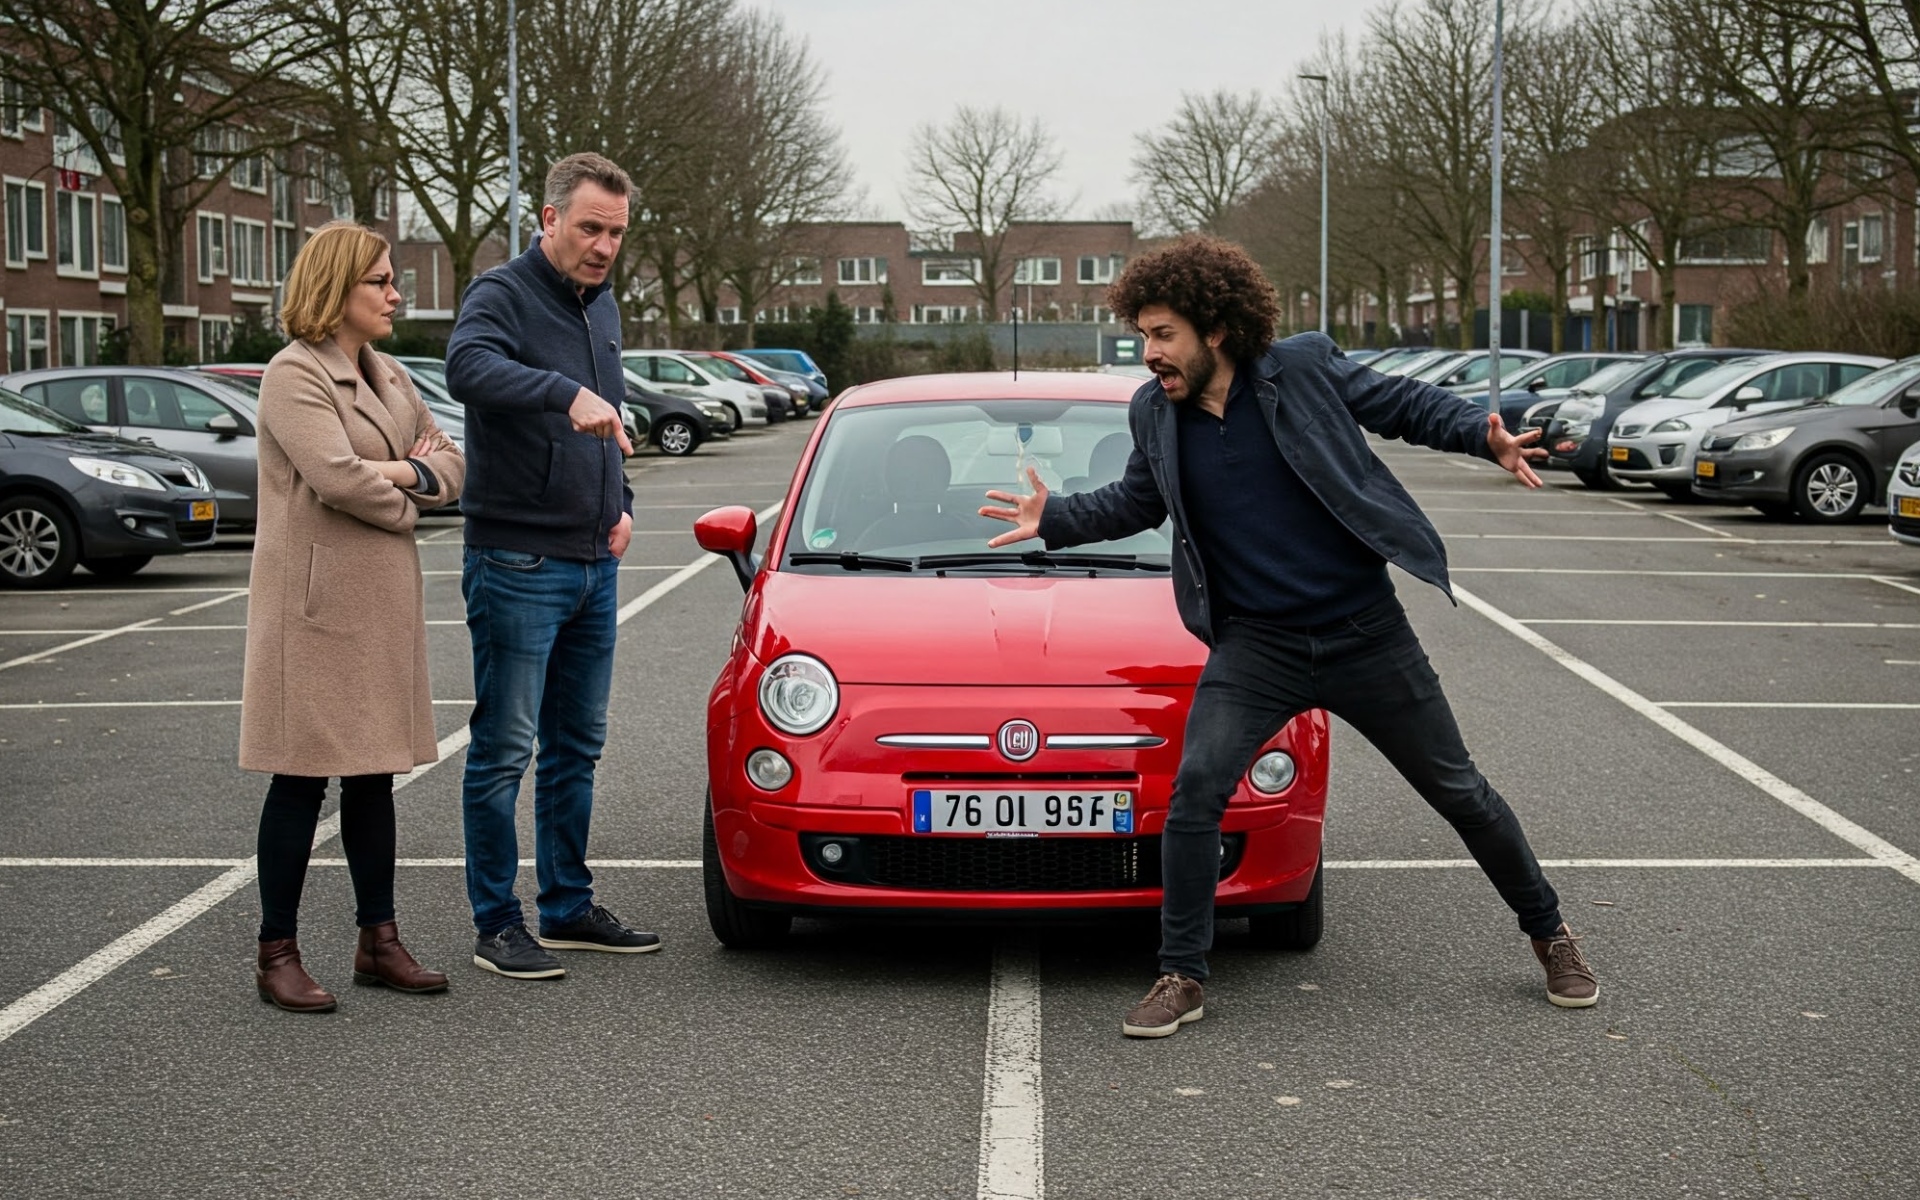
A total of 1,250 Dutch people were asked how they rate the driving style of drivers from different countries. Italians and Poles came out worst. More than 40 percent consider their driving behavior (very) bad. On the other hand, the Danes are actually popular: 70 percent call their driving style good or even very good. Germans, Swedes, Swiss and Norwegians also receive ample satisfaction: two-thirds of those surveyed are positive about them.
EU accident statistics
This appreciation seems to be reflected in EU accident statistics. Between 2013 and 2023, an average of 475 Danes per million inhabitants had an accident each year. In the Netherlands, that number is more than twice as high. It is also striking that countries such as Finland, Norway, Cyprus and even Poland have relatively few traffic accidents. Closer to home, the situation is less rosy. In Belgium, Germany and Austria – just across the border – there are far more accidents. The Italians, often seen as dangerous, are only eighth among EU countries with the most accidents per million inhabitants. The chart below gives a good idea of the reality.
| Country | Average number of traffic accidents per million inhabitants | Average number of traffic fatalities per million inhabitants | |
| 1 | Liechtenstein | 8.811 | 53 |
| 2 | Austria | 4.114 | 47 |
| 3 | Germany | 3.559 | 37 |
| 4 | Belgium | 3.324 | 55 |
| 5 | Portugal | 3.166 | 59 |
| 6 | Slovenia | 2.894 | 50 |
| 7 | Malta | 2.816 | 35 |
| 8 | Italy | 2.784 | 53 |
| 9 | Croatia | 2.528 | 76 |
| 10 | Iceland | 2.501 | 33 |

Scandinavia, Switzerland and the Netherlands score well
Fortunately, traffic accidents do not result in fatalities in most cases. Scandinavia, Switzerland and the Netherlands have the lowest number of traffic fatalities per million inhabitants. In countries like Romania, Bulgaria and Latvia, it is just the opposite: there, accidents end fatally more often. Does that have to do with driving habits? Or with the cars themselves?
| Country | Average number of traffic accidents per million inhabitants | Average number of traffic fatalities per million inhabitants | |
| 1 | Denmark | 475 | 30 |
| 2 | Cyprus | 629 | 55 |
| 3 | Finland | 764 | 42 |
| 4 | Norway | 766 | 23 |
| 5 | Poland | 773 | 71 |
| 6 | France | 817 | 48 |
| 7 | Slovakia | 904 | 50 |
| 8 | Bulgaria | 996 | 89 |
| 9 | Greece | 1.014 | 68 |
| 10 | Netherlands | 1.054 | 32 |
Bad driving or old fleet?
According to Mattijs Wijnmalen of Wegenvignetten, high mortality in traffic accidents is not necessarily the result of reckless driving. “Figures from the European automotive trade organization ACEA show that countries like Romania have a relatively old car fleet. New cars are much safer due to mandatory assistance systems and stricter crash tests, where not only occupants but also pedestrians and cyclists are better protected. So when things go wrong then, the chances of a fatality with a modern car are a lot lower than with an older one.”


